
What Affected the English Settlement Population?
|
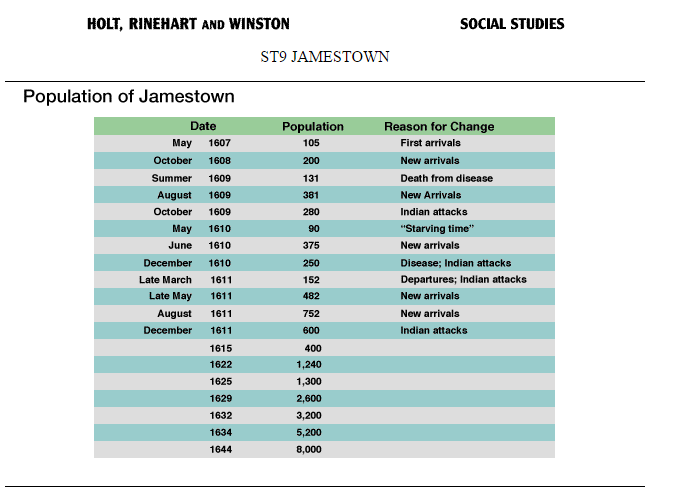
Students will create an infographic to show what affected the population of the early Jamestown Settlement.
They will use Apple Numbers to organize data into a table and generate a graph to represent that information visually. They will import the graph into Apple Keynote where they will create the Infographic. Optional:
|

|
Lesson Plan
STEP 1: Introduction to Spreadsheets
|
Start with an Introduction to Spreadsheets where the students learn:
|
|
STEP 2: Entering data into your spreadsheet

|
Apple Numbers
Students will use Apple Numbers to:

|
Step-by-step video tutorial on how to enter the Jamestown Population data into a chart using the Numbers Spreadsheet on an iPad.
| ||
STEP 3: Introduction to Graphing
|
Present the "Introduction to Graphing" where the students will learn:
|
|
STEP 4: Creating the Graph

|
Apple Numbers
Students will use Apple Numbers to:

Sample graph
|
Step-by-step video tutorial on how create the Jamestown Population graph using the Numbers Spreadsheet on an iPad.
|
STEP 5: Introduction to Infographics
|
Present the "Introduction to Infographics" where students will learn that infographics are:
|
|
STEP 6: Creating the Infographics
This is where you get to tell your story. What is it that you want to say about the data?
Apple Keynote
|
Students will use Apple Keynote to:
|

|
|
1. Overview
Recap goal of the project |
2. Keynote - Getting Started
Start Keynote project, picking theme and layout |
3. Keynote - Adding Numbers Graph
|
|
4. Keynote - Add Images
|
5. Keynote - Adding Images Quickly Quick Tip
|
6. Keynote - Working with Image Tips
How to delete and copy and paste an image |
|
7. Keynote - Adding other Elements
Adding arrows |
8. Keynote - Sharing Your File
Share your Keynote file or export it as an image |
STEP 7: Analyzing the Data
Another thing you can do with Spreadsheets is to "analyze" the data. Here is an activity you can do with the class. I've created a new version of the Jamestown Population Numbers spreadsheet. Instead of putting the numbers in directly into the cells, I've calculated the population through addition and subtraction of the number of people. This enables us to do "what-if" scenarios. The big take-away is "What if any one ship of new arrivals did not make it?" You will see that it is likely the colony would not have survived and Jamestown may have gone the way of other colonies.

|
| ||
Project Resources
Here are some resources students can use for the project:
|
Discovery Education (requires password): Problems at Jamestown: work, disease, and starvation.
History Channel Video: Jamestown Colony
History Channel: Jamestown Founded in 1607 (the populations numbers don't match, nudity in a drawing)
Discovery Education: Starving Time
|
